|
The following is reprinted from What Every Pregnant Woman Should Know, a book on the Brewer Diet, by Gail
Sforza Brewer and Tom Brewer, MD, first published in 1977.
"The Afflicted Child: Preventing Low Birth Weight" (p. 88)
More than 240,000 low-birth-weight babies are born annually in the United States. The percentage of such babies has risen
steadily since the early 1950's. By 1968, 7.7 percent of all American babies were underweight at birth according to government
sources. If a spring 1976 survey of four thousand new mothers done by Mothers' Manual is reliable, the figure has
skyrocketed to 13.5 percent among middle and upper income families.
For stories of twins and triplets carried to term weighing 7 to 8 pounds, see here...
For a comparison between the Brewer Diet and the ACOG Diet, see here...
See here for more information on the link between low birth weight and inadequate prenatal nutrition
The 1972 United Nations Statistical Handbook discloses that low birth weight runs up to 60 percent higher in the United States
than in some other advanced nations. The figures for Scandinavian countries show they have reduced low birth weight to 3
percent. In the People's Republic of China, it is less than 3 percent.
What is going wrong?
Does a baby's birth weight matter that much?
Definitely. Birth weight is the most accurate indicator of a baby's health and future mental and physical development. Babies
born underweight have markedly reduced chances for survival, for normal intelligence and for coordinated movement. A report
by the U.S. Department of Health, Education and Welfare in 1972 detailed the higher risks of death and permanent disability
faced by the underweight newborns. Two-thirds of all deaths occurring to the the twenty-eighth day of life happen to low-birth-weight
babies. This death rate is thirty times higher than in babies of normal birth weight.
Half of all low-birth-weight babies will grow up with I.Q.'s of less than 70, the cutoff point for severe mental retardation.
Three and a half times more infants of low birth weight suffer other neurologic deficits, such as cerebral palsy, epilepsy,
learning disabilities and behavioral disorders.
It is a grim picture. Yet low birth weight does not arise from unknown cause. It is not a matter of heredity. In fact,
the vast majority of cases are completely preventable. Every mother can take steps to protect her unborn baby from low birth
weight by following a good diet during pregnancy.
It has been known since the 1920's that maternal nutrition influences birth weight more than any other factor. Many international
researchers and practitioners have long since proved that the quality of the mother's diet has everything to do with her baby's
birth weight and subsequent development.
A landmark volume presenting the writings of just a few standouts would include:
Honora Acosta-Sison, Philippines, 1929
Guttorum Toverud, Norway, 1931
Sir Edward Mellanby, England, 1933
Winslow T. Tompkins, 1941
John Ebbs, Toronto, 1942
Bertha Burke, Boston, 1943
A.N. Antonov, Russia, 1947
William Dieckmann, Chicago, 1951
Reginald Hamlin, Australia, 1952
Hilda Knobloch and Benjamin Pasamanick, New York, 1956
Benjamin Platt, England, 1964
Thomas Brewer, San Francisco, 1966
Leela Iyengar, India, 1967
J.F. Kerr Grieve, Scotland, 1974
Agnes Higgins, Montreal, 1976
Jay Hodin, executive director of the Society for the Protection of the Unborn through Nutrition (SPUN) and author of an exhaustive
analysis of studies on malnutrition and developmental disabilities has noted: "Many of these investigators report results
in which the probability that prenatal nutrition is unrelated to infant health is less than one in a billion"
In most of their papers one finds appeals for aggressive action to prevent low birth weight. The prescription, based on their
own clinical experience, is almost always the same: improve maternal health by dietary intervention and low birth weight will
virtually disappear.
Just what constitutes low birth weight? What size baby is normal? For many years, the figure five and a half pounds was
used as a line of demarcation between low and normal birth weight. This figure was also used as the official standard for
determination of prematurity. Most of these cases of low birth weight traditionally have been accounted for by a shortened
period of gestation, with less than the thirty-eight weeks considered the minimum time necessary for complete fetal development.
In recent years, however, there had been a dramatic upsurge of low-birth-weight at term babies--those who weigh less than
five and a half pounds after a full forty weeks gestation. There is evidence that these babies are at far greater risk than
those born too early. The concept of "weight for gestational age" is replacing the straight five and a half pounds as an
indicator of a baby's chances for normal health and development. Under this system, the underweight-for-date baby causes
more concern among high-risk nursery personnel than the infant who is premature, but normal-for-date. Both types of low-birth-weight
infants result primarily from maternal malnutrition.
Agnes Higgins of Montreal has stated that any baby weighing less than seven pounds at birth reflects some degree of sub-optimal
maternal nutrition. Many agree with her that five and a half pounds may be a valid indicator for infant survival, but mere
survival is not enough, especially when it is possible with our present knowledge and resources to feed every pregnant woman
the diet she and her baby need for optimal health. Mrs. Higgins, whose program at the Montreal Diet Dispensary includes distribution
of milk, eggs, and oranges to women who need them to supplement their diets, pegs the cost of this extra food at $125 per
pregnancy [1977 economy]. The cost of maintaining a low-birth-weight baby in an intensive care unit can exceed $300 a day
[1977]. The cost of institutionalizing a severely retarded child for life runs to $900,000 [1977].
See here for more information about Agnes Higgins' work at the Montreal Dietary Dispensary
Following the lead of Bertha Burke with whom she studied, Mrs. Higgins stresses a high-protein, high-calorie diet: she aims
for 100 grams of high-quality protein and 2,600 calories a day. Mothers with twins require an additional 30 grams of protein
and 500 extra calories--all provided by an extra quart of milk daily.
Burke found that the level of protein intake in the diet is directly reflected in the length and weight of the child at birth.
In her 1940's study groups at Harvard, all babies weighed at least six pounds when the mother's diet contained 80 or more
grams of protein a day. The median weight in this group was eight and a half pounds. When mothers obtained less than 45
grams of protein daily, 47 percent of the babies weighed under five and a half pounds.
Burke determined that for every additional 10 grams of protein added to the mother's diet (up to 100 grams), the baby's birth
weight would increase by one-half pound. Iyengar in India substantiated that this could be done as late as the last four
weeks of gestation with positive effect on the baby's birth weight.
How exactly does the mother's diet determine the way her baby grows? As we have mentioned, the placenta is the organ which
nourishes the baby from the earliest weeks of pregnancy. A multi-service organ, it works as the baby's stomach, liver, kidneys,
and lungs until the moment of birth. At birth, a healthy placenta weighs one and a half to two pounds, is the size and shape
of a small dinner plate and is an inch or more thick. Its large flat surface is firmly attached to the wall of the uterus
where, under normal conditions, it remains throughout labor, separating from the uterus and being expelled only after the
baby is born. Blood vessels form a network throughout the placenta, feeding into the baby via the umbilical cord. The cord
is the lifeline from mother to baby through which 300 quarts of blood per day are circulated. Many square yards of contact
surface develop in the placenta over the course of the pregnancy to facilitate the vital exchange of nutrients and waste products
between mother and baby.
After the mother eats a meal, the food is digested, absorbed, and passed into her liver which then releases essential nutrients
into her bloodstream. These predigested nutrients reach a level of concentration higher in the mother's blood than in the
baby's, so they readily pass through the very thin walls of the baby's capillaries into the baby's circulation. This process
of diffusion works the same way in the transfer of oxygen from mother to baby. The nutrient-rich blood finally circulates
through the baby's liver where the nutrients are recombined into the protein building blocks the baby needs for growth and
development. There is no direct mixing of the baby's blood with the mother's. Each remains in its own circulation. Yet,
they are intimately connected.
The outdated idea that the placenta can somehow extract nutrients from the mother which are not in her circulation is a threat
to sound pregnancy nutrition. In a sense, the baby is in competition with all the tissues of the mother's body which also
require continual nourishment from her bloodstream. If the mother fails to take in all the essential nutrients in large enough
proportions to sustain the increased demands of pregnancy, her baby will not magically receive what it needs for optimal growth.
The baby does not have top priority for nutrients. In fact, there are numerous reliable studies which show the opposite.
Aaron Lechtig and his collaborators have reported that even moderate maternal malnutrition interferes with the process of
placental cell proliferation, resulting in abnormally small placentas. When the size of the placenta is reduced, the surface
area available for nutrient transfer is correspondingly reduced. Many researchers now conclude that small placentas result
in low-birth-weight babies. Very simply, a small placenta cannot transfer as many nutrients to the growing baby as a larger
one. So, the baby does not weigh as much as it should at birth, even if it is born at term.
During the last eight weeks of pregnancy the baby gains an ounce a day. Brain development is occurring at the most rapid
rate ever. The baby requires more oxygen and nutrients of types--including proteins, vitamins, minerals and calories--than
earlier in pregnancy. If the mother is told she has gained enough weight already and put on a low-calorie, low-salt diet
at this crucial time, the baby will be denied the nutrients needed to accomplish normal development. A restrictive diet is
also likely to cause the mother's blood volume to shrink, reducing the amount of blood flowing through the placenta. The
baby can suffer intrauterine growth retardation from this reduction of placental blood flow. When less blood passes through
the placenta, fewer nutrients pass to the baby during any given period of time.
The National Institutes of Health Collaborative Study of Cerebral Palsy in 1968 drew a clearcut relationship between
weight of the placenta and birth weight of the baby. When the placentas in one study group weighed only seven to fourteen
ounces, over 22 percent of the babies weighed less than five and a half pounds. In another group, the placentas weighed fourteen
to twenty-one ounces and low birth weight dropped to 3 percent. In over 1,700 cases the placenta weighed more than twenty-one
ounces. Low birth weight fell to 0.5 percent in this group! A total of 31,966 infants were evaluated in this study, a large
enough sample to meet any standard of scientific evidence! Clearly, maternal nutrition governs the size of both placenta
and baby. It is also responsible for the secure implantation of the placenta on the uterine wall.......
.......In the last trimester, a healthy placenta is necessary for optimal development of another crucial organ, the baby's
brain. The brain grow in two ways. Cells divide to make new ones and individual cells enlarge as they mature. Malnutrition
retards both these processes, but it is especially devastating during the period when new cells are forming.
Cell division is most rapid and, therefore, most vulnerable from one month before birth until five months after. Never again
will the baby's brain experience such an incredible proliferation of new cells. All of the eleven billion neurons, the cells
which process and analyze information, are formed before birth. Inadequate nutrition during gestation results in permanent,
irreversible deficits in the number of cells which make up the baby's brain.
Other problems also arise. Without adequate nutrition, the brain cells which do exist are likely to be malformed and their
interconnections impaired. Learning problems and poor motor coordination are traced by many pediatric neurologists to these
abnormalities.
Dr. Arnold Gold of Columbia University, addressing the Fall 1976 meeting of the American Foundation for Maternal and Child
Health, stated his belief that minimal brain damage in all social groups is primarily the result of intrauterine malnutrition.
In his own practice he sees children who have a variety of difficulties which he attributes in many cases to minimal brain
damage not readily discernible at birth. Their parents or teachers report the children are hyperactive, have a short attention
span, are frustrated easily, are delayed in meeting developmental milestones, have poor coordination and poor school performance
or seem immature.
Citing the work of Knobloch and Pasamanick who in the 1950's outlined a "continuum of reproductive casualty" caused by low
birth weight, Dr. Gold charted the overt and minimal damage done to cerebral function by malnutrition:
|
Function
|
Overt
|
Minimal
|
|
Motor
|
Cerebral palsy
|
Clumsiness
|
|
Sensory
|
Blindness
Deafness
|
Impaired spatial perception and shape memory
|
|
Mental
|
Low I.Q.
|
Poor abstract reasoning
Hyperkinesis
|
|
Speech
|
Aphasia
|
Delayed speech
Language difficulties
|
|
Convulsive
|
Epilepsy
|
Abnormal electroencephalogram (EEG)
|
Very little maternal malnutrition is required to produce these abnormalities. Researchers in England, for example, think
even mild degrees of maternal undernutrition in the last few weeks of gestation can compromise the intricate process of brain
cell division and integration. Especially vulnerable in their view is the cerebellum, the part of the brain which coordinates
voluntary muscular movement.
Dr. Benjamin S. Platt, of the London School of Tropical Medicine, produced these disorders experimentally by restricting protein
and calories in pregnant animals during his 30 years of research. He believed that the consequences of protein-calorie malnutrition
which he documented in over five thousand laboratory cases were the same in human mothers as in other species of mammals.
A member of the World Health Organization Joint Expert Committee on Nutrition for many years, Platt wrote that his colleagues
treated his thesis with "undisguised scorn...because of the tendency, particularly marked among clinicians, to ignore or disparage
experimental work on animals, often for no other reason than because the results have been obtained on animals."
Platt summarized his findings in 1968:
We have found throughout our experimental work that the earlier in life the animal is subjected to dietary deficiency,
the more pronounced and extensive are its effects....Malnutrition lowers maternal efficiency and leads to the production of
underweight babies, many of whom will die before reaching two years of age, whilst among their survivors there will be some
who never reach their full physical or mental potential....Expert committees have met to discuss the problem of "low birth
weight," though, still, I may say, with scant attention to the possible role of the nutrition of the mother.
When physicians responsible for giving prenatal care discount the work done on nutrition in animals, they are left with few
guidelines for human nutrition. Doctors who treat the malnutrition thesis of reproductive casualty with "undisguised scorn"
often state that they would be convinced if somebody would show them results of a truly controlled experiment in which some
mothers were starved and others fed. To obtain the results to satisfy them, human mothers, pre-selected to share characteristics
of statistical significance would have to spend their entire pregnancies in a laboratory. Their diets would be rigidly managed
so no deviations would be possible. Their rates of exercise, rest and sleep would be recorded, along with notations of how
much of each food each mother ate. Mothers' weight gains and losses would be charted. Fetal and placental growth and maturation
would be determined by a sophisticated battery of tests. All mothers would be monitored, as were the astronauts in space,
twenty-four hours a day.
After the babies were born they would be wired for metabolic assessment, too. A computer might have to be installed to handle
all the information about differences between deprived and well-fed infants.
The researchers would then spend five years converting all their data to mathematical models, publishing their formulas, addressing
major scientific symposia and establishing their academic reputations as unbiased investigators of the most impeccable order.
In fact, it will never be possible to satisfy the demands of those who call for inhumane experimentation of this sort. So
these physicians will continue to remain unconvinced of the evidence that speaks for the importance of their pregnant patients'
nutrition. They will continue to promote the view that "There's no hard data proving that nutrition has anything to do with
pregnancy outcome"--a classic Catch-22.
History, however, has provided analogous situations in which human mothers, albeit not pre-selected, have been subjected to
severe nutritional deprivation on a large scale. These historical "experiments" support the malnutrition thesis and discredit
other theories which have obscured its role for many years.
The most stark example comes from the World War II Nazi blockade of Leningrad. During the seventeen-month siege, from August
1941 to December 1942, no food could be shipped into the city. The conditions of famine were so harsh that many women ceased
menstruating, few conceived, and among those who did, the rates of spontaneous abortion, stillbirth, infant mortality and
low birth weight surged upward.
A. N. Antonov, a Russian pediatrician who lived and worked through the siege, reported his observations in one clinic in the
Journal of Pediatrics in 1947. One of the most striking developments he noted was the drastic decline in births (despite
the fact that much of the army had retreated into the city). From 3,867 in 1941 the number plummeted to 493 in 1942. Of
these, 414 occurred in the first half of the year--babies conceived before the siege began. Only 79 were born in the second
half of 1942--those conceived after the siege began.
The 414 babies born in the first half of 1942 were subjected to severe intrauterine malnutrition during the last half of pregnancy,
the critical period of brain development and weight gain. Of them, 49 percent weighed less than five and a half pounds at
birth. Forty-one percent failed to attain normal length, measuring less than eighteen and a half inches. In the first half
of the year, 256 of the 414 died--an infant mortality rate of 618 per thousand. Antonov described the babies as being frail
with thin skull bones and high-pitched cries. They sucked poorly on mothers who produced little milk.
Dr. Antonov concluded:
Hunger, vitamin deficiency, cold, excessive physical strain, lack of rest, and constant nervous tension had their effect
on the health of the women, and the intrauterine development of the fetuses, and the condition of the newborn children during
the siege....
The cause of the unusually high proportions of premature births and of stillbirths in the first half of 1942 was hunger during
pregnancy, that is, the insufficient quantity and unsatisfactory quality of the women's food.
In addition to these catastrophic effects on the unborn, maternal starvation was also responsible for a five-fold increase
in convulsive MTLP [Metabolic Toxemia of Late Pregnancy], reported later by Persianov, a Moscow OB/GYN specialist.
What does this tragic story from the past have to do with American obstetrics today? The message is clear: mothers must not
be starved during pregnancy and though most American women may not literally be hungry, those who receive inadequate and incorrect
advice about their diets are starving for the nutrients they and their babies need.
At the top of the list of malnourished pregnant women are those who have been told by their doctors to:
1. restrict weight
2. restrict salt
3. take diuretics [rare in 2007]
Virtually every pregnant woman in America in the last thirty years [as of 1977] has been exposed to one or another of these
useless pieces of dietary advice at some point in her pregnancy, which accounts for the widespread upsurge of low birth weight
and brain-damaged children in our country. As Dr. Arther Sackler, international publisher of the Medical Tribune,
commented in 1974:
I don't know how much more one needs to shock our medical consciences. One does not have to be a physician to be concerned
with the epidemic of defective neonates (babies less than twenty-eight days old)....Nothing can be lost and potentially infinite
suffering may be prevented by instituting simple, preventive nutritional measures and withholding questionable medications
during pregnancy.
Note from Joy: While the use of amphetamines and diuretics may no longer be considered the mainstream treatment
of choice for the symptoms of toxemia, other methods of weight control in pregnancy and treatments for toxemia are currently
in vogue which are equally hazardous to both the baby and the mother. And unfortunately, the hazards of these current treatments
are no more recognized by the mainstream practitioners of today than were the hazards of the earlier use of amphetamines and
diuretics by the practitioners of yesterday. I have been witness to some of the current hazardous treatments, just within
the past 5-10 years.
I worked for a homebirth midwifery practice for several years. For most of that time, all the midwives were supportive of
the use of the Brewer Diet by the clients of the practice. The last year of my time there, we got a new midwife on staff
who was very opposed to the use of the Brewer Diet. Whenever we got a new client who was the least little bit on the plump
side, she would apparently tell her to get a little more exercise and eat a little less carbohydrates. When her blood pressure
would start to creep up, she would tell her to cut back on her salt a little bit. No amount of my trying to explain the Brewer
insights to her made any headway. As a result, within the first six months of her being on staff, we had 2-3 clients who
had to be hospitalized with blood pressure problems and premature labor, as I recall, which was very uncharacteristic of our
practice.
So it is very important that we not dismiss the historical accounts that Brewer has documented for us. We need not look down
our noses at his reports of the starvation-amphetamine-diuretic practices of the physicians around him in his early days,
and his efforts to stop those practices. We have our own faulty treatments in our own time, which are based on the same faulty
thinking, and are just as hazardous as the treatments that he witnessed.
In addition, unfortunately, some areas of the "alternative medicine" community have apparently followed mainstream medicine
in the belief that diuretics are important and useful for treating edema and elevated blood pressure in pregnancy. Many pregnancy
teas and some supplements and juices include nettle, dandelion, alfalfa, bilberry, or celery, all of which have diuretic properties.
Diuretics are no safer for pregnancy in herbal form than they are in prescription medications, so it is important for pregnant
women to watch which herbs they are taking.
See here for more information on the hazards of using herbal diutetics in pregnancy
Nutritional Deficiency in Pregnancy
|
Complications
|
Control Group (750)
|
Nutrition Group (750)
|
|
Preeclampsia
|
59
|
0
|
|
Eclampsia
|
5
|
0
|
|
Prematures
(5 lb. or less)
|
37
|
0*
|
|
Infant Mortality
|
54.6/1,000
|
4/1,000
|
--Adapted from Winslow Tompkins. Journal of International College of Surgeons 4:417, 1941.
(*Smallest baby weighed 6 lb. 4 1/2 oz.)
Dr. Charles Lowe, then scientific director of the National Institute of Child Health and Human Development, agreed in 1972
after reviewing the dramatic decline in low-birth-weight rate (from 13.7 percent to 2.8 percent in women having their first
babies) in the Contra Costa County prenatal clinics during the toxemia prevention project. Recognizing that this result was
obtained exclusively by the use of scientific nutrition education and the abandonment of symptomatic therapies, Dr. Lowe commented:
These conclusions challenge the conventional wisdom, which demands constraint on weight gain by caloric restriction, a
limitation of salt intake, and the use of saline diuretics. None of these were used in the Brewer series....Why is our prematurity
rate rising, a factor of life in no other advanced nation? The answer may well lie in our prenatal regimens. It looks as
if we can make real progress on both questions merely by feeding pregnant women.
All these conclusions point to the fact that we already have a reliable method for the prevention of many of the common complications
of pregnancy, in particular of the metabolic toxemia of late pregnancy and of low-birth-weight babies. It is clearly improper
to say that we need "more studies" before implementing sound maternal nutrition for all pregnant women. To continue to study
the ravages of these preventable complications in pregnant women and their babies is to cruelly ignore the evidence already
available.
Obstetricians trained in the United States over the past twenty years [50 yrs, as of 2007] will probably continue to have
trouble accepting the "new look" in human maternal-fetal nutrition. Each one will only be able to learn for himself by trying
these methods with pregnant mothers. As they do, they will be gratified by the healthful outcomes produced by this approach
to pregnancy management.
The Brewer Medical Diet for Normal and High-Risk Pregnancy available here
Salt in Pregnancy
| |
High Salt Diet
|
Low-Salt Diet
|
|
Toxemia
|
37/1000
|
97/1000
|
|
Perinatal deaths
|
27/1000
|
50/1000
|
|
C-section
|
9/1000
|
14/1000
|
|
Abruptio placenta
|
17/1000
|
32/1000
|
--Adapted from Margaret Robinson. "Salt in Pregnancy," Lancet 1:178, 1958.
The following is reprinted from Nine Months, Nine Lessons, by Gail Sforza Brewer, 1983 (p. 50).
Placenta
As Figure 8 shows, it is also the action of your uterus that separates your placenta and expels it in the third stage of labor.
This organ allows nutrients and oxygen to pass from your bloodstream into your baby's and also permits the removal of waste
products from the baby's body. The placenta originated in cells from the fertilized egg. Enzymes on the surface of the ovum
dissolved away a tiny portion of the surface of your uterine wall, opening a few arteries and veins in the process. With
each beat of your heart, from that moment until your placenta comes away from the wall of your uterus, those arteries spurt
jets of nutrient- and oxygen-rich blood against the surface of the placenta. This is the only blood supply to this most important
organ, and only what is present in your bloodstream can nourish it and your developing baby.
The placenta is firmly anchored to the wall of your uterus by threads of collagen throughout and by a seal around its margin.
Because of this, the blood that swirls up against the placenta stays in a "lake," continuously bathing the placental tissue.
This blood does return to your heart after spending some time in the "lake," via the open veins that now function like the
drain in you tub or shower stall: the pooled blood is pushed into the veins by the force of new blood coming into the "lake"
from the open arteries. Technically, this sort of blood supply is termed an a-v (arterio-venous) shunt, meaning that
the blood passes directly from arteries to veins without first passing through capillaries (the usual way things are done
in the body).
Since the supply of blood encourages and supports placental growth, and a larger placenta requires more blood to keep it functioning
optimally, ever-increasing amounts of blood are required as pregnancy advances to satisfy the needs of the placenta. If you
are carrying a single baby, your blood volume will expand approximately 60 percent (if you eat well enough) to service your
placenta. If you have twins (and therefore a double placenta or two separat placentas), your blood volume must expand by
100 percent or more to stay even with the demand. A falling blood volume or a blood volume that is below the needs of your
pregnancy is recognized as a major cause of premature labor, underweight babies, and high blood pressure during pregnancy.
When you recognize the importance of keeping your blood volume up and your placenta healthy (even though you can't see it
or feel it), you will have a strong inducement to stay on your excellent pregnancy diet every day.
See here to better understand the evolution of the mainstream medical perspective on nutrition and salt in pregnancy
Nine Months, Nine Lessons available here
 |
|
Medical research during the last 40 years [as of 1978] has clearly shown that the following pregnancy complications can be
directly caused by malnutrition.
A. For Mothers:
- Metabolic toxemia of late pregnancy (MTLP)
- Preterm separation of the placenta (afterbirth)
- Severe infections
- Severe anemias
- Miscarriages and molar pregnancy
- Premature labor and delivery
- Prolonged and difficult labor
B. For Babies:
- Stillborn babies, especially when MTLP and premature separation of the placenta occur
- Lowered birth weight
- Prematurity
- Severe infections
- Hypoglycemia
- Birth defects, especially defects of the brain leading to cerebral palsy, epilepsy, mental retardation, hyperactivity,
and learning disabilities
|
|
|
|
The following is reprinted from Medikon International no. 4 - 30-5-1974.
"Iatrogenic Starvation in Human Pregnancy", by Tom Brewer, M.D., County Physician, Contra Costa County Medical Services,
Richmond, California, U.S.A.
Frank Hytten tells us in his pregnancy physiology textbook of two pioneers in the field of iatrogenic starvation in human
pregnancy.(1) A certain Professor Brunninghausen of Wurzburg decided, for reasons unstated, that it was better for women
to eat less food during pregnancy; this was in 1803. A century later Prochownick is given credit in 1899 for introducing
the idea that caloric and fluid restrictions during human pregnancy could produce an infant who weighed less at birth.(2)
The intention of Prochownick was to minimize the cephalopelvic disproportion in a woman with a borderline contracted pelvis
and thus reduce the incidence of surgical intervention in such patients. As surgical techniques developed with the practices
of asepsis and improved anesthesia established, Western European obstetricians lost all fear of operative delivery. Prochownick's
valuable clinical observation that caloric and fluid restrictions do in fact lower the birth weight of the newborn human infant
was forgotten. Thus a very important clue to the mystery of "low birth weight for dates" newborns was buried.
Unfortunately, this still universal misconception became established as a dogma in clinical obstetrical teachings in Western
medical culture: the human fetus is a parasite, will grow according to its "genetic code" to a given weight and length before
birth, and that this growth and development are in no concrete, material sense influenced by the foods and fluids the pregnant
woman is taking in during the course of her gestation.(3,4) Scientific obstetrics still suffers today from what I term "nutritional
nonchalance" related to this false belief.
In 1972 officially in the United States the cause of eclampsia, the disease I term convulsive metabolic toxemia of late pregnancy
(MTLP), was "unknown."(5,6) [This official assertion continues into 2008] Since this dread disease remains a common cause
of maternal, fetal and newborn morbidity and mortality throughout the world, speculations about its etiology continue. It
has been long believed that the Nutrition of the pregnant woman during gestation does in fact influence her development
of MTLP. Women who develop MTLP are still accused of eating too many calories and too much salt (NaCl). That such
an idea remains popular in 1973 stems from the fact taht very few Western-trained OB/GYN surgeons have ever taken time or
interest to ask these poor women what foods and how much they have been eating and drinking during pregnancy.
When I began to work in the Tulane Service's prenatal clinics at Charity Hospital, New Orleans, Louisiana, as a third year
medical student, pregnant patients were being told to restrict their caloric intake and to restrict their dietary salt intake:
"So you won't have fits....so you and your baby won't die from toxemia." It is difficult for me to learn what is happening
there now since no members of the Tulane faculty will communicate with me, but unofficial sources informed me not long ago
that "...nothing has changed in this field since you were here over 20 years ago." I studied this problem for four years
in another city-county hospital in our deep south. Jackson Memorial Hospital, Miami, Florida, from 1958 to 1962.
A reliable communication from an established ostetrician in Miami in March, 1973 informed me that "...nothing has changed
in this field since you left here over ten years ago." The common practices of weight control and dietary salt restriction
seem eternal.
Since it is now clear that the sudden, rapid weight gain observed in patients with severe MTLP is a result of malnutrition
with a falling serum albumin concentration, hemoconcentration, a falling blood volume with increasing interstitial fluid,
we no longer need to blindly "control weight" with starvation type diets. However, fear of the unknown drives the most rational
and "scientific" people to irrational actions; millions of pregnant women in Western European medical culture still suffer
from iatrogenic starvation diets in the vague hope that caloric and salt restriction will in some way protect them and their
unborn from the "ancient enigma of obstetrics," eclampsia.
Iatrogenic starvation in human pregnancy has a long and ignoble history in the United States: its traditions run strong and
deep in one of our oldest and most respectable journals of obstetrics, the American Journal of Obstetrics and Gynecology.
In its second volume published in 1921 we find this account by Rucker:
"On August 2nd, two weeks after her first visit, her blood pressure was 120/80, the urine was free from albumin and sugar.
On August 17 her weight had increased 6 pounds and her legs were swollen up to her knees. She had no headache. Blood pressure
was 180/90. Urine was free from albumin and sugar. She was placed upon a bread and water diet." (emphasis added)
"A week later, August 24, in spite of her rigid diet, she had gained 8 3/4 pounds more. (emphasis added) Her blood
pressure was 205/110 and she was having pains in the back of her head and was seeing specks before her eyes. The urine showed
a trace of albumin. No casts were found."(7)
Subsequently this poor woman had 11 convulsions. It is now clear that a "bread and water diet" is not effective prophylaxis
for MTLP!
In the very first volume of The American Journal of Obstetrics and Gynecology published 53 years ago [as of1974], Ehrenfest
reviewed "Recent Literature on Eclampsia," and found that venesection was still in common use for this dread disease: "For
the purpose of reducing the blood pressure and of eliminating toxins...."
He reported another then widespread approach: "Diuretics should be accompanied by a total or partial restriction of salt.
No meat shall be allowed." (emphasis added) Ehrenfest also noted the beginning of a scientific rejection of blood-letting
in the management of eclampsia: "Cragin says: Eclampsia patients after convulsions resemble so closely patients in shock,
that venesection seems illogical. They seem to need all the blood they have and more too."(8)
Here was the obvious clinical recognition of the hypovolemic shock which so commonly causes maternal and fetal deaths in severe
metabolic toxemia of late pregnancy.(9) The illogical use of salt diuretics in this disease may be viewed now as a "modern"
form of blood-letting in which electrolytes and water of the blood are forced out of the patient's body via her kidneys, a
kind of cell-free venesection!
In April, 1969, I presented a paper to an international meeting on "toxemia of pregnancy" in Basel, Switzerland, by invitation
of Dr. E.T. Ripperman, Secretary of the Organization Gestose.(10) Here I learned these interesting facts:
- Eclampsia has virtually disappeared from Switzerland; there had been no maternal death from this disease in Basel for
almost two decades.
- Some Swiss OB/GYN professors were still teaching that the pregnant woman must avoid red meat as prophylaxis against
eclampsia; for the Swiss this prescription seems to be working.
- The incidence of low birth weight babies born in the University Hospital, Basel, in the year 1967, from some 3,000 deliveries
was 3.0%.
It soon became apparent here from my discussions with many European OB/GYN authorities that the general nutritional status
of the peoples of Central Europe was exceptionally good, and that this adequate nutrition was the basic cause for the elimination
of severe MTLP and for the relatively low incidence of low birth weight infants.
My own paper presented in Basel was received with the utmost skepticism: the European obstetricians almost to the man responded:
"Surely there is no severe malnutrition in rich America." Surely? The incidence of low birth weight in our nation has risen
from 7.0% in 1950 to 10.0% now [1974] with much higher figures for all our poverty areas; MTLP continues to cause maternal-fetal
and newborn morbidity and mortality. Iatrogenic starvation during human pregnancy is still widely practiced throughout our
nation today because none of our medical or "public health" institutions have taken concrete actions to stop it.
A review of the unbound issues of The American Journal of Obstetrics and Gynecology reveals that for most of the 1950's and
1960's amphetamines and other "diet pills" were widely advertised for "weight control" in human pregnancy. Salt diuretics,
long recognized to be lethal to the severely toxemic patient and to her fetus, were promoted by this journal form 1958 to
1972. Professor Leon Chesley finally recognized their harmful effects on the maternal plasma volume.(11) The advertisements
for these water pills were then stopped but not their widespread use.
Today in 1973 the problems of rising prices for essential foods like lean meats, chicken, eggs, vegetables and fruits, and
the continuing poverty and economic depression in many areas of our nation can not be solved by the nation's physicians.
However, do not humane physicians today have a special and moral responsibility to stop the blind errors of iatrogenic
starvation in human pregnancy? Do not obstetricians, especially, in charge of human antenatal care in public clinics
and private offices, have a responsibility to their pregnant patients to give them scientific nutrition information? The
protective effects of applied, scientific nutrition in human antenatal care have recently been dramatically documented by
Mrs. Agnes Higgins of the Montreal Diet Dispensary.(12) The rationale for blind weight control to any "magic number" of pounds
in human pregnancy has been completely destroyed.(13) What then must the obstetricians of our nation do? What actions must
they take to insure maternal-fetal and newborn health for each woman who wants to produce a normal, full term child and remain
in good health herself?
- Recognize the complications of human pregnancy caused by malnutrition.(14)
- Teach each pregnant woman as a routine part of modern, scientific prenatal care, the basic principles of applied scientific
nutrition.
- Insure that she actually eats an adequate, balanced diet all through gestation.
- Encourage her to salt her food "to taste." (with rare exception)
- Stop "weight control" to any number of pounds. (when nutrition is adequate and balanced, the weight gain takes
care of itself with an average gain in healthy pregnancy of about 35 pounds)
-
Protect each pregnant woman and her unborn from all harmful drugs, especially salt diuretics and appetite depressants.
-
On the postpartum wards educate all pregnant patients who have suffered nutritional complications during pregnancy--so that
those complications will not recur in subsequent pregnancies.(15)
-
Stop iatrogenic starvation in human pregnancy.
These measures will begin to open a new era in preventive obstetrics in our nation and dramatically reduce the numbers of
low birth weight and brain-damaged and mentally retarded children now being born.
More information on underweight babies follows these references
REFERENCES
- Hytten, F.E. and Leitch, I. The Physiology of Human Pregnancy. 2nd edition, Oxford, Blackwell Scientific Publications,
1970.
- Prochownick, L. "Ein Versuch zum Ersatz der Kunstlichen Fruhgeburt" (An attempt towards the replacement of induced premature
birth. Zbl. Gynak. 30:577, 1889.
- Williams, Sue Rodwell. Nutrition and Diet Therapy, 2nd Edition. St. Louis, Mosby, 1973, Chapter 17.
- Brewer, T.H. "Human Pregnancy Nutrition: an examination of traditional assumptions" Aust. N.Z. J. Obstet. Gynaecol. 10:87,
1970.
-
Pitkin, Roy M., Kaminetzky, Harold A., Newton, Michael, and Pritchard, Jack A. "Maternal nutrition: a selective review of
clinical topics" Obstet. Gynecol. 40:773-785, 1972.
-
Brewer, T.H. "Human maternal-fetal nutrition". Obstet. Gynecol. 40:868-870, 1972.
-
Rucker, M. Pierce. "The Behavior of the uterus in eclampsia" Amer. J. Obstet. Gynecol. 2:179-183, 1921.
-
Ehrenfest, Hugo. "Collective review: recent literature on eclampsia". Amer. J. Obstet. Gynecol. 1:214-218, 1920.
-
Brewer, T.H. "Limitations of diuretic therapy in the management of severe toxemia of pregnancy: the significance of hypoalbuminemia"
Amer. J. Obstet. Gynecol. 83:1352, 1962.
-
Brewer, T.H. "Metabolic toxemia of late pregnancy: a disease entity" Gynaecologia 167: 1-8, 1969. (Basel)
-
Chesley, Leon C. "Plasma and red cell volumes during pregnancy" Amer. J. Obstet. Gynecol. 112:440-450, 1972.
-
Primrose, T. and Higgins, A. "A study in human antepartum nutrition" J. Reproduct. Med. 7:257-264, 1971.
-
Pomerance, J. "Weight gain in pregnancy: how much is enough?" Clin. Pediat. 11:554-556, 1972.
-
Brewer, T. "Metabolic toxemia: the mysterious affliction." J. Applied Nutrition 24:56-63, 1972.
-
Brewer, T.H. "A case of recurrant abruptio placentae." Delaware Med. J. 41:325-331, 1969.
The following is from a chapter reprinted by permission from 21st Century Obstetrics Now! (David Stewart, PhD,
and Lee Stewart, CCE, Editors), National Association of Parents & Professionals for Safe Alternatives
in Childbirth, 1977. (p. 387)
"Why Women Must Meet the Nutritional Stress of Pregnancy" (p.387)
See here for the entire chapter that these charts were taken from
TABLE 4
RELATIONSHIP BETWEEN PRENATAL NUTRITION
AND BIRTH WEIGHT
|
Nutritional
Status of
Gravid Women
|
# of
Women
|
% Low
Birth
Weight
|
Significance Level of
Difference with Fairly
Nourished Group
|
|
GOOD
|
63
|
3.2
|
p<.005
|
|
FAIR
|
272
|
11.0
|
- - -
|
|
POOR
|
28
|
33.0
|
p<.005
|
TABLE 5
RELATIONSHIP OF BIRTH WEIGHT
TO PRENATAL NUTRITION
|
Prenatal
Diet
|
Good or
Excellent
|
Fair
|
Poor or
Very Poor
|
|
Number of
Infants
|
31
|
149
|
36
|
|
Average
Birth Weight
|
8lb,8oz
(3856 g)
|
7lb,7oz
(3374 g)
|
5lb,13oz
(2637 g)
|
TABLE 6
EFFECT OF SUPPLEMENTATION ON
DECREASING LOW BIRTH WEIGHT INCIDENCE
|
|
|
Amount of Caloric
Supplementation
During Pregnancy
|
Less
Than
5,000
|
5,000
to
19,999
|
At Least
20,000
Calories
|
|
Number of Women
|
82
|
89
|
117
|
|
% Low Birth Weight
|
13.4
|
7.1
|
3.5
|
|
|
|
TABLE 7
LOW BIRTH WEIGHT INCIDENCE
AND DURATION OF PARTICIPATION
|
|
|
Weeks of
Nutrition
Counseling
|
Live
Births
|
Low
Birth Weight
Infants
|
% Low
Birth
Weight
|
|
1-12
|
519
|
51
|
9.83
|
|
13-20
|
499
|
39
|
7.82
|
|
At least 21
|
713
|
29
|
4.07
|
|
All cases
|
1,731
|
119
|
6.87
|
|
|
|
FIGURE 1. Effect of nutrition education and food supplementation on birth weight for mother of 11.
|
|
|
Child
|
Nutrition Education
or Supplementation
|
Approximate
Birth Weight
|
|
First--Female
|
None
|
2,700 grams
(6 pounds)
|
|
Second--Male
|
None
|
2,500 grams
(5 lbs 8 oz)
|
|
Third--Male
|
None
|
1,800 grams
(4 pounds)
|
|
Fourth--Female
|
None
|
2,300 grams
(5 lbs 1 oz)
|
|
Fifth--Female
|
None
|
2,100 grams
(4 lbs 10 oz)
|
|
Sixth--Male
|
None
|
2,800 grams
(6 lbs 3 oz)
|
|
Seventh--Male
|
None
|
2,300 grams
(5 lbs 1 oz)
|
|
Eighth--Male
|
None
|
1,800 grams
(3 lbs 15 oz)
|
|
Ninth--Female
|
Both
|
3,200 grams
(7 lbs 1 oz)
|
|
Tenth--Male
|
Both
|
3,800 grams
(8 lbs 6 oz)
|
|
Eleventh--Female
|
Both
|
3,400 grams
(7 lbs 8 oz)
|
|
|
|
TABLE 8
INFLUENCE OF NUTRITION EDUCATION
IN LOWERING RISK OF LOW BIRTH WEIGHT
| |
# of Women
|
% Low Birth Weight
|
|
Infants born to primigravidas
Receiving Nutrition Education
|
321
|
2.8
|
|
Infants born to other primigravidas
Attending same County Clinic
|
1,237
|
13.7
|
TABLE 9
INFLUENCE OF NUTRITION
ON SURVIVAL AND WEIGHT AT BIRTH
|
|
|
Calories
or
Nutrient (g)
|
Optimum
Requirements
(As stated by
the Authors)
|
Approximate
Stillbirths
|
Daily Intake
Low
Birth Weight
Infants
|
by Group
Normal-
Weight
Infants
|
|
Calories
|
2,500
|
1,644
|
1,710
|
1,946
|
|
Carbohydrates
|
350
|
207
|
217
|
217
|
|
Fat
|
80
|
61.4
|
64.9
|
80.4
|
|
Protein
|
90
|
52.4
|
54.5
|
72.1
|
|
High-Quality Protein
|
50
|
27.4
|
29.9
|
45.9
|
|
Calcium
|
1.5
|
0.7
|
0.8
|
1.2
|
|
Phosphorus
|
2.0
|
0.9
|
0.9
|
1.4
|
|
Iron (mg)
|
15.0
|
9.0
|
9.0
|
11.0
|
|
|
|
TABLE 10
ASSOCIATION OF BIRTH WEIGHT
WITH VARIOUS TESTS AND MEASUREMENTS
|
Examination
|
Mean Difference Between the
Higher Birth Weight Twins
and the Lower Birth Weight Twins
|
Significance
Level
|
|
Vocabulary Test
|
2.50
|
ns
|
|
I.Q.
|
6.75
|
p<.05
|
|
Height
|
4.34 cm (1.7 in.)
|
p<.01
|
|
Head Circumference
|
1.34 cm (0.5 in)
|
p<.001
|
|
Weight
|
3.95 kg (7 lb. 15 oz.)
|
p<.001
|
TABLE 11
ASSOCIATION OF BIRTH WEIGHT WITH I.Q.
AND MEASUREMENTS AMONG MONOZYGOTIC TWINS
|
|
|
Examination
|
Mean Difference Between the
Higher Birth Weight Twins
and the Lower Birth Weight Twins
|
Significance
Level
|
|
I.Q.
|
6.56
|
p<.05
|
|
Height
|
5.89 cm (2.3 in.)
|
p<.001
|
|
Head Circumference
|
1.67 cm (0.7 in.)
|
p<.01
|
|
Weight
|
4.81 kg (9 lb. 11 oz.)
|
p<.001
|
|
|
|
TABLE 12
ASSOCIATION BETWEEN BIRTH WEIGHT
AND RISK OF HANDICAP (514 Cases)
|
|
|
Birth Weight
|
Degree
Moderate
or Severe
|
of
Mild
|
Handicap
Little
or None
|
|
1250 grams
(2 lb, 12 oz)
|
64% (23)
|
17% (6)
|
19% (7)
|
|
1251-1500 grams
(2 lb, 12 oz
to 3 lb, 5 oz)
|
34% (16)
|
21% (10)
|
45% (21)
|
|
1501-1750 grams
(3 lb, 5 oz
to 3 lb, 13.75 oz)
|
19% (5)
|
23% (6)
|
58% (15)
|
|
1751-2000 grams
(3 lb, 13.75 oz
to 4 lb, 6.5 oz)
|
12% (8)
|
30% (20)
|
58% (39)
|
|
2001-2250 grams
(4 lb, 6.5 oz
to 4 lb, 15.5 oz)
|
4% (2)
|
23% (13)
|
74% (42)
|
|
2251-2500 grams
(4 lb, 15.5 oz
to 5 lb, 8 oz)
|
3% (3)
|
16% (19)
|
81% (94)
|
|
2501 grams
(5 lb, 8 oz)
and over
|
1% (2)
|
12% (20)
|
87% (143)
|
|
|
|
TABLE 13
INFLUENCE OF BIRTH WEIGHT
ON DISTRIBUTION OF I.Q. SCORES
BY SOCIOECONOMIC STATUS
|
|
|
Socio-
economic
Class
|
I.Q. Centile
|
Birth
2000
and Under
|
Weight (g)
2001-2500
|
|
Middle
|
Under 25th
25th to 75th
Over 75th
Total
|
55% (29)
36% (19)
9% (5)
100% (53)
|
39% (26)
44% (29)
17% (11)
100% (66)
|
|
Working
|
Under 25th
25th to 75th
Over 75th
Total
|
64% (29)
25% (11)
11% (5)
100% (45)
|
36% (28)
47% (37)
18% (14)
100% (79)
|
|
Lower
|
Under 25th
25th to 75th
Over 75th
Total
|
52% (14)
44% (12)
4% (1)
100% (27)
|
48% (15)
45% (14)
6% (2)
100% (31)
|
|
|
|
TABLE 14
RELATIONSHIP BETWEEN BIRTH WEIGHT
AND CHILDHOOD BEHAVIOR
BY SOCIAL CLASS
|
|
|
Socioeconomic
Class
|
Total #
of
Children
|
%
Stable
|
%
Unsettled
|
%
Maladjusted
|
|
Birth
Middle
Working
Lower
|
Weight
42
36
28
|
Under
69
47
36
|
2001
24
19
36
|
grams
7
33
29
|
|
Birth
Middle
Working
Lower
|
Weight
71
54
29
|
Over
79
70
45
|
2500
15
20
41
|
grams
6
9
14
|
|
|
|
TABLE 15
RELATIONSHIP BETWEEN I.Q. AND BIRTH WEIGHT
AMONG 51 RETARDATES AND MATCHED CONTROLS
|
|
| |
Average
I.Q.
|
Average
Birth Weight
|
Average Birth Weight
Exclusive of Low
Birth Weight and/or
Premature Children
|
|
MALES
Retarded
Children
Control
Group
|
70
121
|
3020 grams
(6 lb, 10.63 oz)
(N = 25)
.........(p<.002)
3750 grams
(8 lb, 4.37 oz)
(N = 25)
|
3300 grams
(7 lb, 4.5 oz)
(N = 20)
.........(p<.002)
3830 grams
(8 lb, 7.25 oz)
(N = 24)
|
|
FEMALES
Retarded
Children
Control
Group
|
67
124
|
3020 grams
(6 lb, 10.63 oz)
(N = 25)
.........(p<.002)
3750 grams
(8 lb, 4.37 oz)
(N = 25)
|
3080 grams
(6 lb, 12.75 oz)
(N = 20)
.........(p<.002)
3440 grams
(7 lb, 9.37 oz)
(N = 25)
|
|
|
|
N = Number of Children
TABLE 16
ASSOCIATION BETWEEN BIRTH WEIGHT
AND DEVELOPMENT OF RDS
|
Birth Weight
|
Total #
of
Children
|
Incidence
of RDS
|
Incidence of
Severe RDS
|
|
1250 grams or less
|
12
|
75%
|
42.0%
|
|
Over 1250 grams
|
28
|
32%
|
3.5%
|
TABLE 17
RISK OF MENTAL RETARDATION
AMONG CHILDREN WITH RDS
| |
# of
Children
|
Incidence of Mental
Retardation Among
Children with RDS
|
|
Severe RDS
|
6
|
67%
|
|
Less Severe RDS
|
12
|
8%
|
TABLE 18
RISK OF RDS AND CONCOMMITANT MORTALITY BY BIRTH WEIGHT,
CORD PROTEIN LEVELS, AND LENGTH OF GESTATION
|
|
| |
# of
Infants
|
%
With RDS
|
Lvl. of
Signif.
|
%
Mortal.
|
|
Low Birth Weight
|
171
|
17.5
|
|
11.1
|
|
Birth Weight
Over 2500 grams
|
2,039
|
|
p<10-12
|
*
|
|
Cord Protein of
4.6 g/100 ml or less
|
98
|
|
|
20.4
|
|
Cord protein greater than
4.6 g/100 ml
|
2,102
|
|
p<10-12
|
*
|
|
Low Birth Weight and
Low Cord Protein
(4.6 g/100 ml or less)
|
60
|
|
|
30.0
|
|
Normal Birth Weight
and/or normal cord
Protein (at least
4.7 g/100 ml).
|
2,140
|
|
p<10-15
|
*
|
|
Premature (less than
37 weeks' gestation)
and Low Blood Protein
|
58
|
|
|
32.8
|
|
Normal Length of Gestation
and Normal Blood Prot.
|
2,142
|
|
p<10-15
|
*
|
|
|
|
TABLE 19
RELATIONSHIP OF PRENATAL NUTRITION
AND BIRTH WEIGHT TO NEONATAL HEALTH
|
|
| |
Pediatric
Superior
|
Ratings
Good
|
of
Fair
|
Infants
Poor
|
|
Number
of infants
|
23
|
84
|
76
|
33
|
|
Average
Birth
Weight
|
8lb, 2oz
(3685g)
|
7lb,12oz
(3515g)
|
7lb, 2oz
(3232g)
|
5lb, 15oz
(2693g)
|
|
Women on Good
or excellent
Prenatal Diet
|
56%
|
19%
|
1%
|
3%
|
|
Women on Poor
or Very Poor
Prenatal Diet
|
9%
|
2%
|
12%
|
79%
|
|
|
|
TABLE 20
INFLUENCE OF DIET IN REDUCING RISK OF
MISCARRIAGE, STILLBIRTH, AND PREMATURE BIRTH
|
|
|
Type of
Diet
|
# of
Women
|
%
Miscarriages
|
%
Stillbirths
|
%
Premature
|
|
Good
|
170
|
1.2
|
0.6
|
3.0
|
|
Supplemented
|
90
|
0.0
|
0.0
|
2.2
|
|
Poor
|
120
|
6.0
|
3.4
|
8.0
|
|
|
|
TABLE 21
PRENATAL DIET BY
CONDITION OF BABY AT AGE TWO WEEKS
|
Prenatal
Diet Group
|
Good
|
Condition
Fair
|
of Baby
Poor
|
Bad
|
|
Good
|
72.2%
|
23.8%
|
1.2%
|
3.0%
|
|
Supplemented
|
90.5%
|
9.5%
|
0.0%
|
0.0%
|
|
Poor
|
62.3%
|
23.7%
|
5.3%
|
8.7%
|
TABLE 22
EFFECT OF NUTRITION ON REDUCING MODERATELY LOW BIRTH WEIGHT,
STILLBIRTH, AND INFANT MORTALITY
|
|
| |
Study
|
Group
|
Control
|
Group
|
Signif.
Level of
Difference
|
|
Total Number
|
750
|
|
750
|
|
|
|
Births Under
5 lb (2268g)
|
0
|
(0%)
|
37
|
(4.9%)
|
p<10-8
|
|
Stillbirths (rate)
|
0
|
0
|
20
|
26.7
|
p<10-6
|
|
Infant Deaths (rate)
|
3
|
4.0
|
41
|
54.6
|
p<10-7
|
|
|
|
TABLE 23
MORTALITY BY DEGREE
OF CALORIC SUPPLEMENTATION
|
|
| |
# of
Women
|
First
6 Months
|
More Than 6
But Less
Than 9 Months
|
Over 9 Months
But Less
Than 1 Year
|
|
High Supple-
mentation
|
199
|
3.0%
|
0.9%
|
0.0%
|
|
Low Supple-
mentation
|
454
|
5.3%
|
1.2%
|
0.6%
|
|
|
|
TABLE 24
ASSOCIATION OF PLACENTAL WEIGHT WITH
LOW BIRTH WEIGHT AND PERINATAL MORTALITY
|
Weight of
Placenta (g)
|
# Live Births
With Known
Birth Weight
|
% Low
Birth Wt.
|
Total
Births
|
%
Perinatal
Mortality
|
|
0-199
|
122
|
88.5
|
318
|
86.5
|
|
200-249
|
311
|
83.6
|
374
|
33.5
|
|
250-299
|
1,129
|
51.9
|
1,192
|
9.4
|
|
300-349
|
3,555
|
26.2
|
3,616
|
2.9
|
|
350-399
|
6,150
|
12.1
|
6,205
|
1.6
|
|
400-449
|
7,283
|
5.1
|
7,331
|
1.4
|
|
450-499
|
5,879
|
2.8
|
5,921
|
1.0
|
|
500-549
|
3,744
|
1.3
|
3,764
|
1.0
|
|
550-599
|
2,056
|
0.9
|
2,072
|
1.0
|
|
>600
|
1,737
|
0.5
|
1,771
|
2.7
|
|
TOTAL
|
31,966
|
10.13
|
32,564
|
3.03
|
TABLE 39
CORRELATION BETWEEN
WEIGHT GAIN DURING PREGNANCY
AND INCIDENCE OF LOW BIRTH WEIGHT
|
|
|
Weight Gain (Pounds)
|
% Low Birth Weight
|
|
Loss
|
17.0
|
|
0-15
|
15.8
|
|
16-25
|
8.2
|
|
26-35
|
4.3
|
|
36 or more
|
3.0
|
|
|
|
TABLE 40
INCIDENCE OF ABNORMAL GROWTH BY WEIGHT GAIN
| |
0-15
Pounds
(%)
|
16-25
Pounds
(%)
|
26-35
Pounds
(%)
|
Over
36 Pounds
(%)
|
|
Weight
|
15.8
|
11.2
|
8.4
|
6.2
|
|
Motor Exam
|
11.3
|
8.0
|
6.8
|
5.2
|
|
Mental Exam
|
12.5
|
9.3
|
8.3
|
7.5
|
|
Height
|
10.1
|
7.5
|
6.5
|
7.3
|
|
Neurologic Test
|
8.8
|
7.5
|
7.9
|
7.1
|
Figure 2. Neonatal mortality risk by birth weight & gestational age. Figures in boxes are percents of babies
within the weight and age ranges of the box that die within the first 28 days after live birth. Especially note that babies
born at term (38-42 weeks) but less than 2,500 grams are more likely to die than pre-term babies born at 30-36 weeks but who
weigh more than 2,500 grams. (Note: 1,000 g = 2.2 lb or 2,500 g = 5.5 lb)

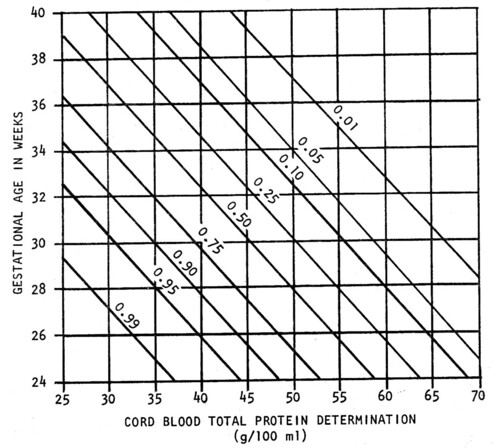
Figure 3. Probability that Respiratory Distress Syndrome (RDS) will develop in a given infant based on determinations
of gestational age and cord blood total protein level as independent variables, with the use of the logistic function.
21st Century Obstetrics Now! Vol. 2 available here
See here for the entire chapter, "Why Women Must Meet the Nutritional Stress of Pregnancy"
|
